Institutional-Grade
Company Analysis
in Minutes
Generate comprehensive 10-tab research reports for any publicly traded company. Financials, strategy, growth, peers, ownership, risks — deep research powered by AI.
10-Tab Reports
Comprehensive Analysis
How It Works
From company name to institutional-grade research report in 6 simple steps.
Enter Company
Type any publicly traded company name or ticker — global coverage included.
AI Researches
Our AI engine collects financial data, strategic insights, and competitive intelligence from 14+ sources.
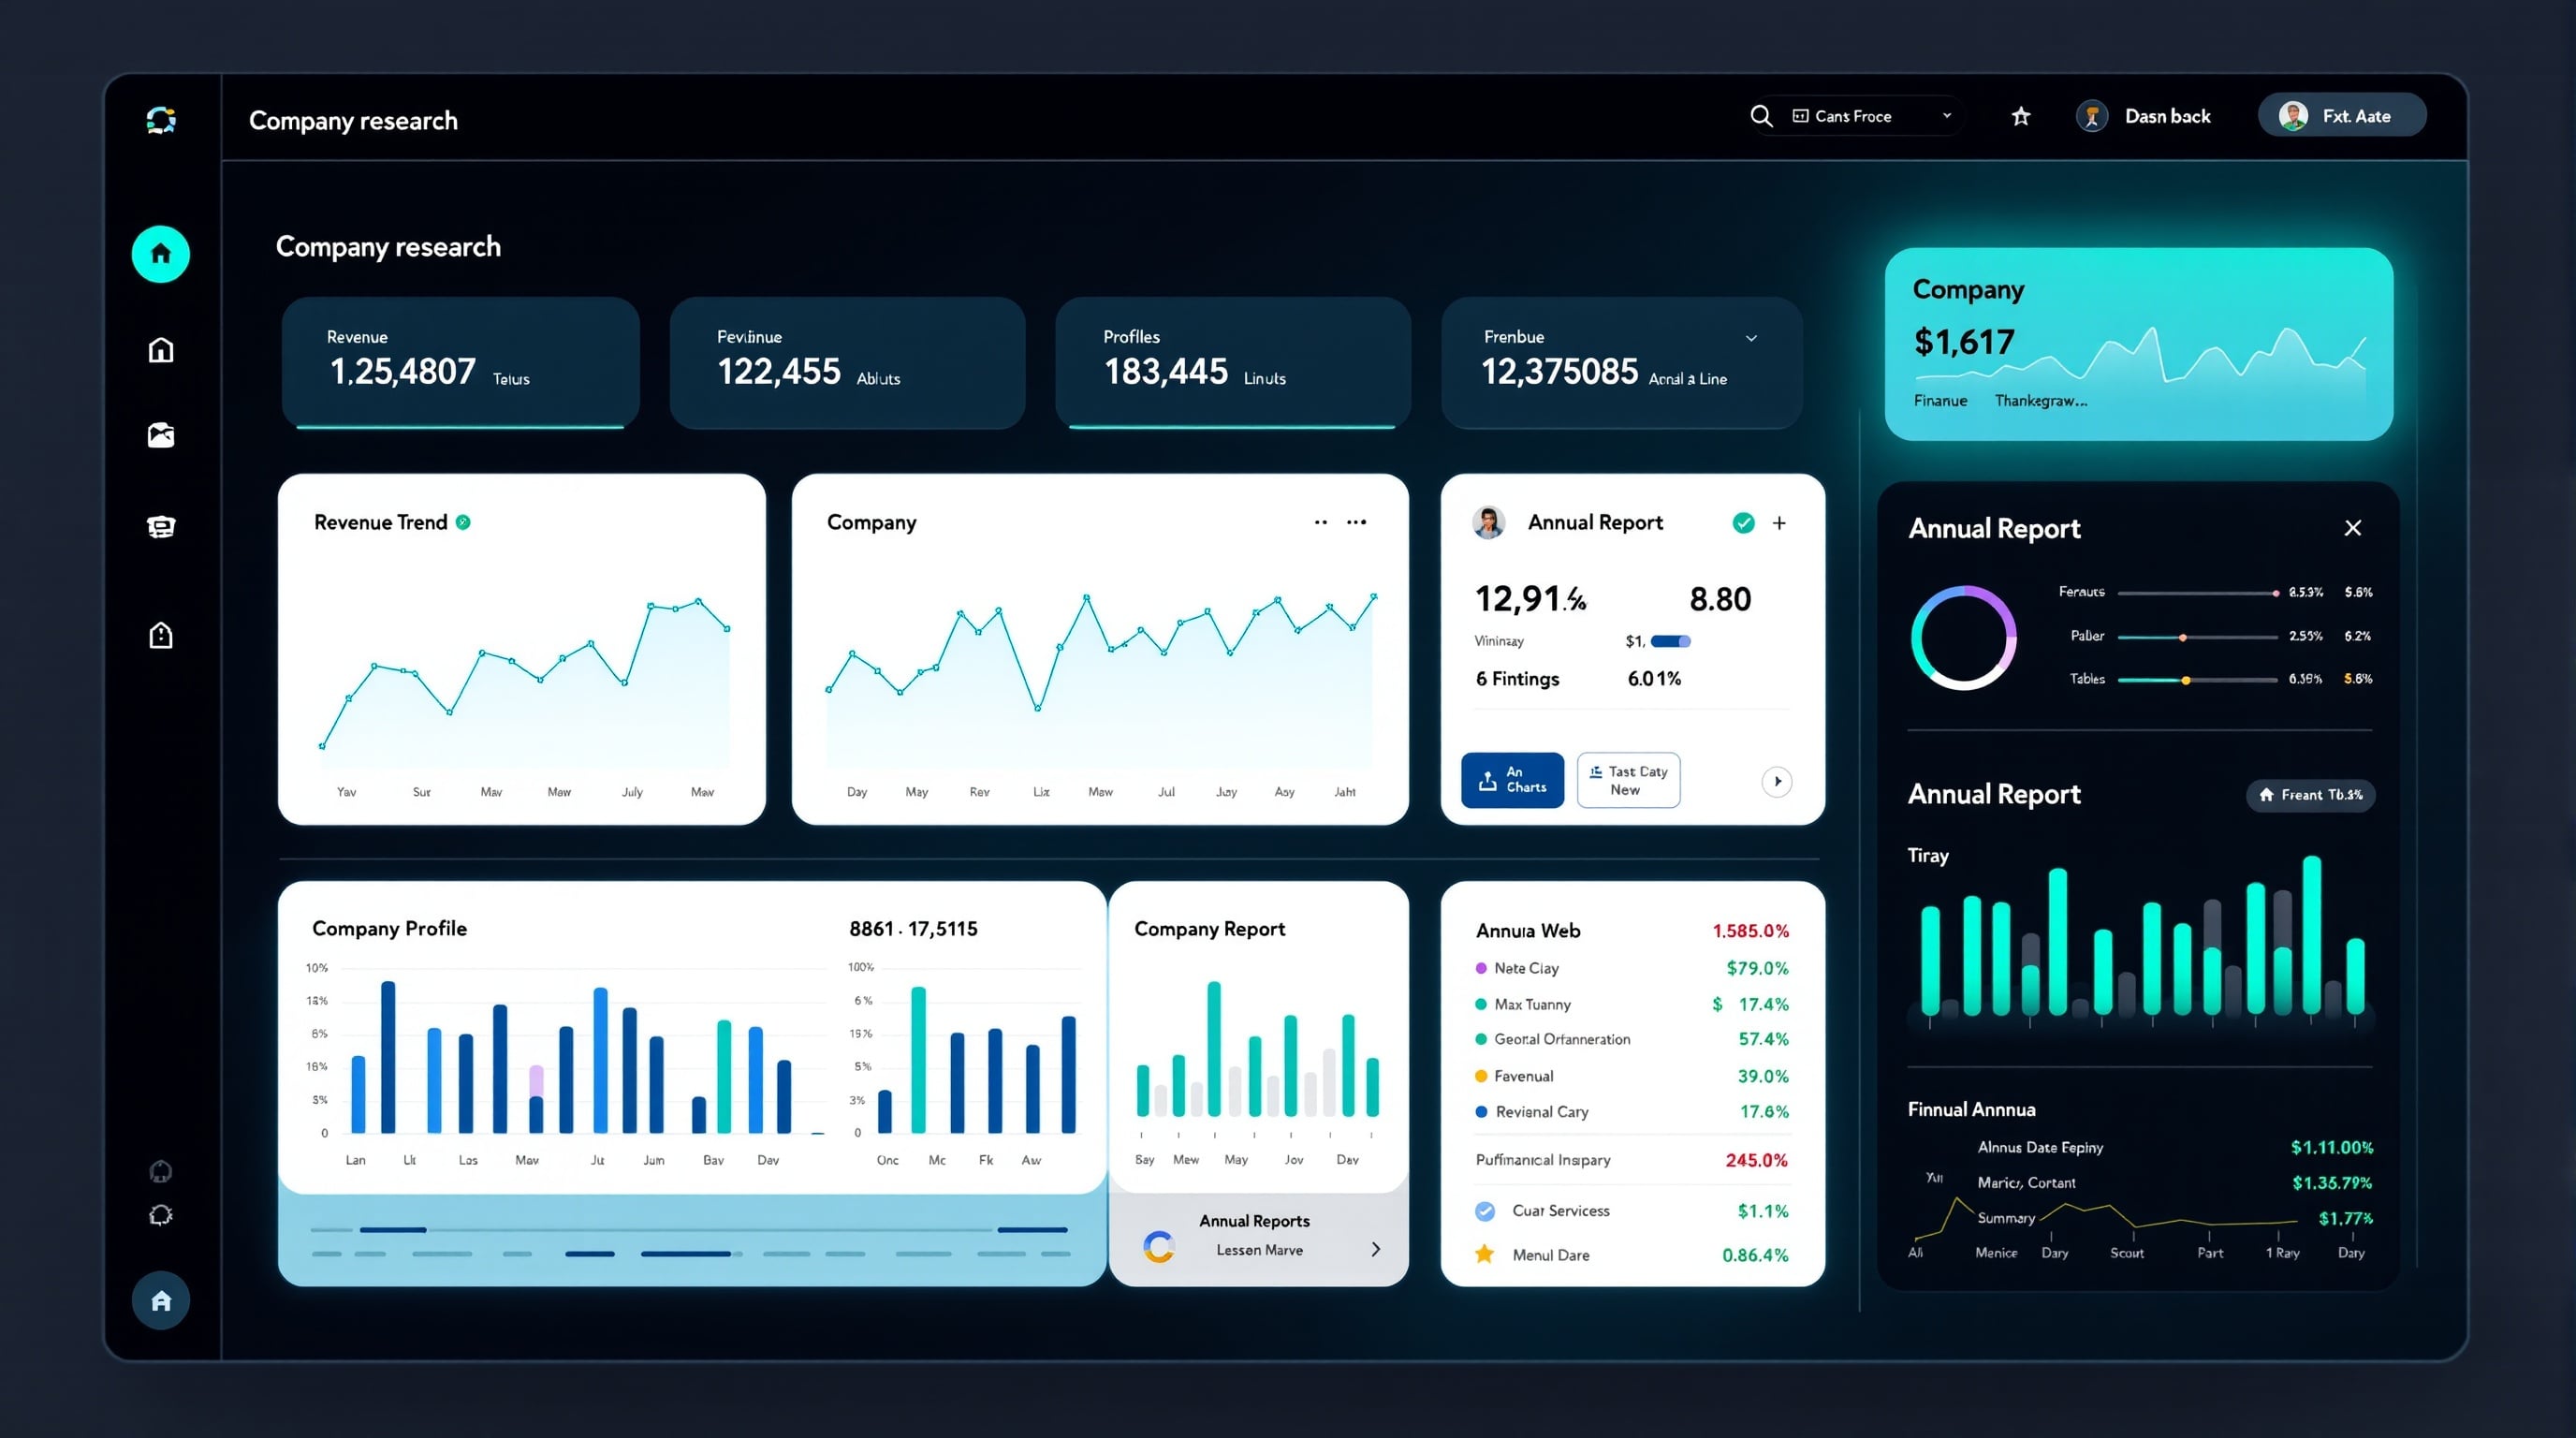
9-Tab Report
Get a deep-dive report covering Financials, Strategy, Growth, Health, Returns, Peers, Ownership, Technology & Risks.
Charts & Data
Real-time market data with interactive charts, technical indicators, and performance tracking.
Export PDF
Download a professional PDF of the complete research for offline review or sharing.
Share Report
Generate secure public links to share your research with colleagues or clients.
See the Full Picture
Every report generates deep-dive analysis across 10 specialized tabs — from valuation multiples to strategic risk mapping.

Everything You Need for Company Research
From financial metrics to strategic risk analysis — completely free, unlimited use.
Valuation Analysis
P/E ratios, DCF models, comparable company analysis, and margin impact on multiples.
Growth Analysis
Revenue CAGR, segment breakdown, market share evolution, and TAM/SAM analysis.
Financial Health
Balance sheet strength, key ratios, margin trends, and cash conversion metrics.
Returns & Capital
ROE, ROIC trends, capital allocation, FCF yield, and dividend analysis.
Peer Comparison
Competitive positioning with peer metrics, moats, and relative valuation.
Ownership Analysis
Institutional holders, insider transactions, promoter holdings, and FII/DII data.
Technology Assessment
Digital capabilities, AI/ML adoption, patent portfolio, and tech-driven advantages.
Strategy & Risks
Strategic initiatives tracker, pain points register, and outcome impact matrix.
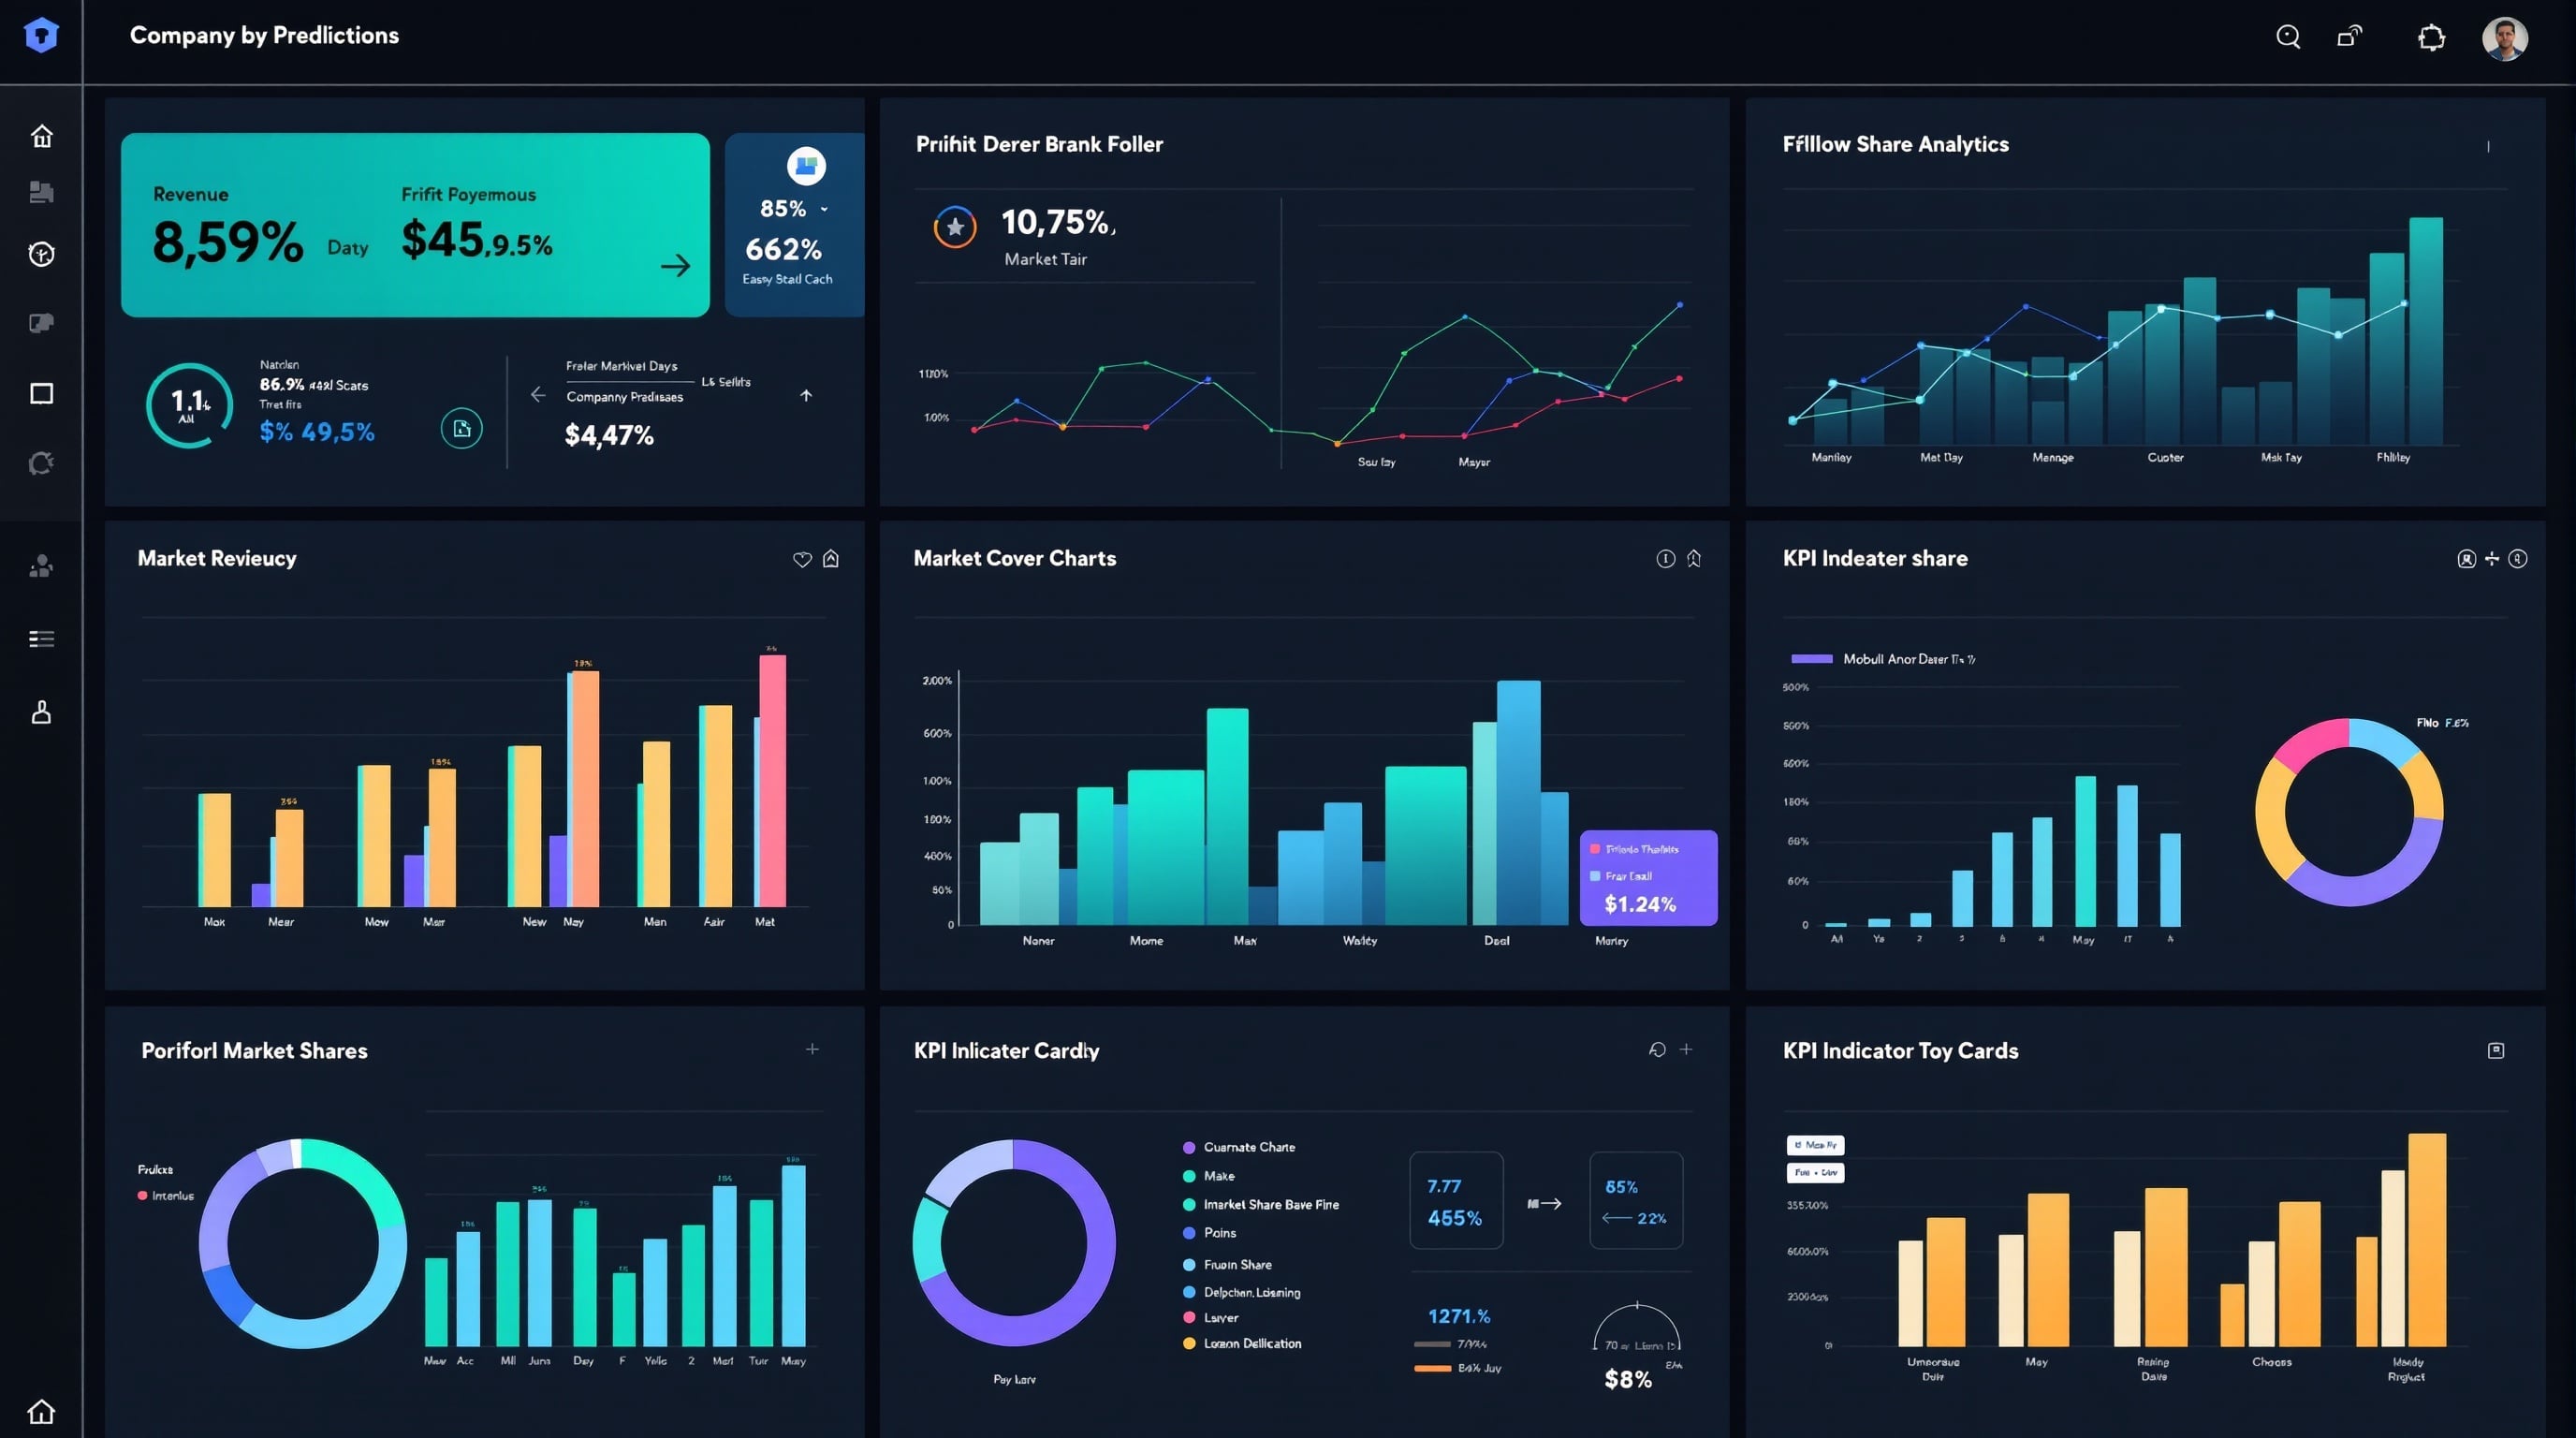
Advanced Charts
Price with SMA 50/200, RSI, volatility, volume, performance bars, and 52-week range.
Share & Export
Public sharing via secure links and professional PDF export of complete reports.

AI That Thinks Like a
Research Analyst
Our AI engine processes hundreds of financial data points, synthesizes information from earnings calls, annual reports, and market data to generate institutional-quality analysis that would take hours manually.
- Signal-based classifications (CHEAP/FAIR/EXPENSIVE, STRONG/WEAK)
- Source-cited metrics with data confidence ratings
- Bear/Base/Bull forward projection scenarios
- Strategic risk mapping with severity ratings
Interactive Charts &
Technical Indicators
Every report includes advanced interactive charts with price action, moving averages, RSI, volatility analysis, and performance tracking across multiple timeframes.
SMA 50/200
Moving averages
RSI
Momentum indicator
Volatility
20-day annualized
Performance
1W to YTD returns

Ready to Transform Your
Company Research?
Join professionals using AI to generate institutional-grade company research in minutes — completely free.